Part 5 of 15Institutional Trading
@AbePublished 6 min read

Fetching the page
Education · Analysis
A trade does not need to win most of the time to have positive expected value. It needs a payoff that compensates for its probability of loss, and position sizing that can withstand an unfavourable run.
Part 5 of 15Institutional Trading
@AbePublished 6 min read
Expected value, losing streaks and decisions under uncertainty
A trade does not need to win most of the time to have positive expected value. It needs a payoff that compensates for its probability of loss, and position sizing that can withstand an unfavourable run.
Desk insight. A higher win rate can still produce a lower expected return. Payoffs and costs complete the calculation.
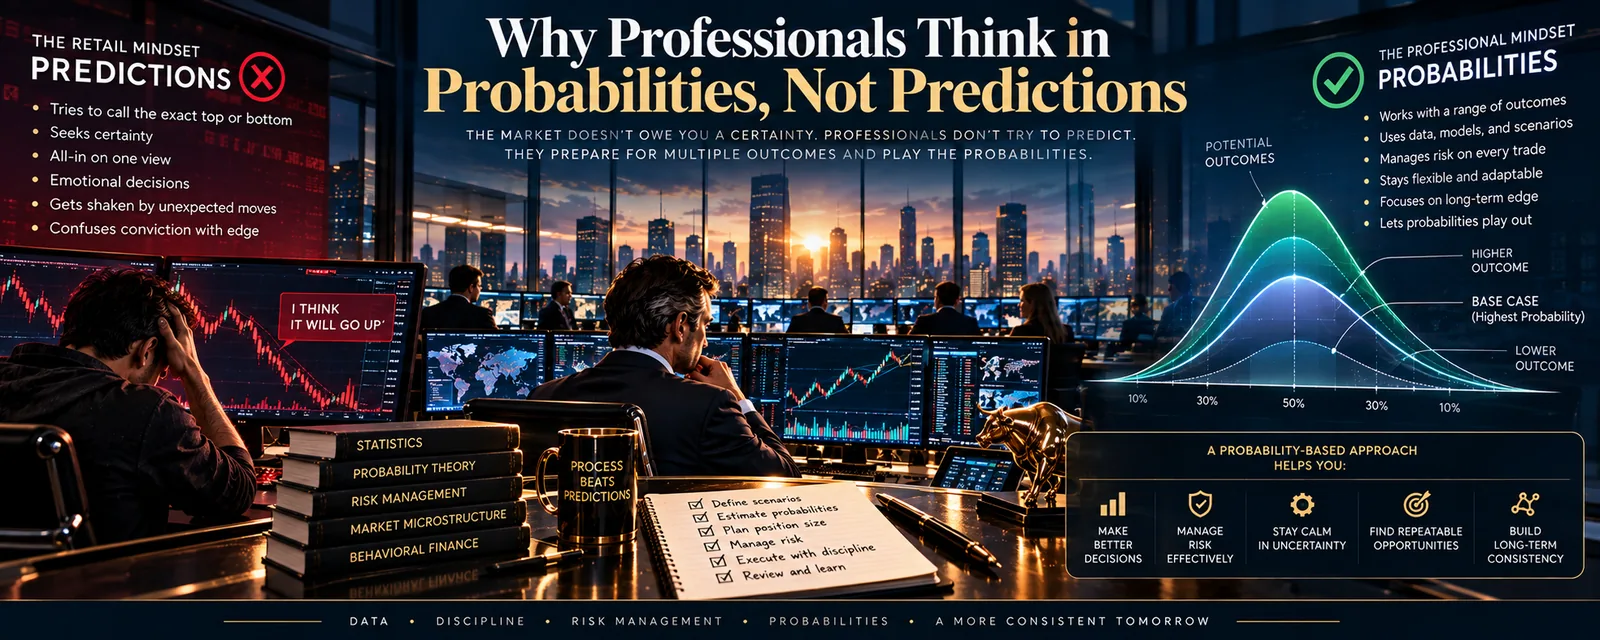
A prediction is a statement about one outcome: “the euro will rise this week”. A probability is a statement about a distribution: “this setup rises six times in ten, and the winners are twice the size of the losers”. The first invites pride. The second invites arithmetic.
A prediction makes every trade a test of whether you were right. Being wrong then feels personal, and people defend personal things.
That is where the damage starts. Stops are moved because the forecast “has not played out yet”. Losers are held because closing them would be an admission. Winners are cut early to lock in proof of being right.
A trader thinking in probabilities has nothing to defend. A loss was always one of the listed outcomes. It was priced in before the order was sent.
The core idea fits on one line.
Expected value = (probability of winning x average win) - (probability of losing x average loss)
A positive estimate suggests an edge only if the inputs are reliable and costs are included. It does not guarantee a profit over a finite sample, and an edge can disappear when conditions change.
Two examples show why win rate alone misleads. Results are measured in R, where 1R is the amount risked per trade.
Expected value before trading costs
| Strategy | Win rate | Average win | Average loss | Expected value per trade |
|---|---|---|---|---|
| A, trend following | 40% | 2.5R | 1R | +0.40R |
| B, quick scalps | 65% | 0.5R | 1R | -0.025R |
With the stated assumptions and before costs, Strategy A has positive expectancy despite losing more often. Strategy B has negative expectancy despite its higher win rate. Win rate alone cannot tell you which process is stronger.
A casino does not know whether the next hand will win. It does not care. It knows the edge, and it knows the number of hands will be large.
The result of a single trade is mostly noise. An edge only appears over dozens or hundreds of repetitions. This is why professionals standardise their setups. A hundred versions of the same bet can be measured. A hundred unrelated bets cannot.
Small position sizes help preserve capital through the sample needed to evaluate a strategy. They reduce the risk of ruin; they cannot guarantee survival or prove that an edge exists.
Assuming independent trades and a constant 40 percent win rate, the chance that a specified block of five trades all lose is 0.6^5 = 7.776 percent, or about 8 percent. Across a hundred trades there are many opportunities for a losing run, but overlapping runs are not independent and several streaks are not guaranteed.
A trader who knows this in advance stays calm at loss number five. A trader who does not concludes the system is broken, abandons it, and starts another just before its own losing streak.
Desks size their risk around the streak they expect. If ten losses in a row is plausible, the risk per trade must be small enough to survive ten.
Ask a macro trader what happens after a central bank meeting and you will rarely get one answer. You get a table.
Illustrative central bank scenarios
| Scenario | Rough probability | Expected market reaction |
|---|---|---|
| Holds rates, cautious tone | 55% | Small move, already priced |
| Holds rates, hawkish tone | 30% | Currency rises sharply |
| Surprise cut | 15% | Currency falls hard |
The numbers are illustrative. The trader then asks which outcome the market is underpricing. The trade may be on the 30 percent case, not the most likely one, because the payoff there is largest relative to its odds.
This is a strange idea at first. A good trade can be one you expect to lose more often than not.
Poker players call it “resulting”: judging a decision by how it turned out. A reckless bet that wins is still reckless.
Professional reviews separate four cases.
Decision quality and outcomes
| Decision quality | Good outcome | Bad outcome |
|---|---|---|
| Good decision | Positive result; review the process | Loss despite sound process; review without overreacting |
| Bad decision | Lucky result; investigate the breach | Loss from a weak decision; correct the process |
A good decision can lose, and a poor decision can win. Review rule adherence separately from the result, then revisit the strategy over a meaningful sample. A losing trade should not automatically trigger a rule change, but it should still be recorded and examined.
Probabilities are not fixed at entry. New information changes them, and position size should follow.
If the reason for a trade weakens, a professional cuts the position before the stop is hit. If the evidence strengthens, the position may grow. The view is held loosely and revised often.
A predictor does the reverse. Evidence against the forecast is explained away, and evidence for it is collected.
Feeling 90 percent sure is not the same as being right nine times in ten. Most people who track their forecasts find their strong convictions are right far less often than they felt.
Keep score. Record probability estimates before outcomes are known, then compare similar estimates with observed frequencies. Fifty observations can begin a review; larger samples are needed for reliable calibration.
Key takeaway. Markets do not reward being right. They reward taking favourable bets repeatedly and surviving the unfavourable results in between.
The useful shift is from defending a forecast to managing a repeatable process. Losing outcomes belong inside that process from the start.
Part 5 of 15 in the series Institutional Trading. Next: The Difference Between Finding a Trade and Manufacturing One.
Independent educational commentary, not investment advice. References to firms do not imply affiliation or endorsement. Figures in examples illustrate a method, not a recommended allocation or a promised outcome. Trading leveraged products carries a high risk of loss.
 AnalysisEducationHuman Trader versus AI TraderA machine can watch thousands of markets without blinking. A human can recognise that the assumptions behind its signals have broken. Speed, breadth and consistency favour AI; context and unfamiliar situations still leave room for judgment. Your trading edge determines which strengths you need.@Abe3 min read
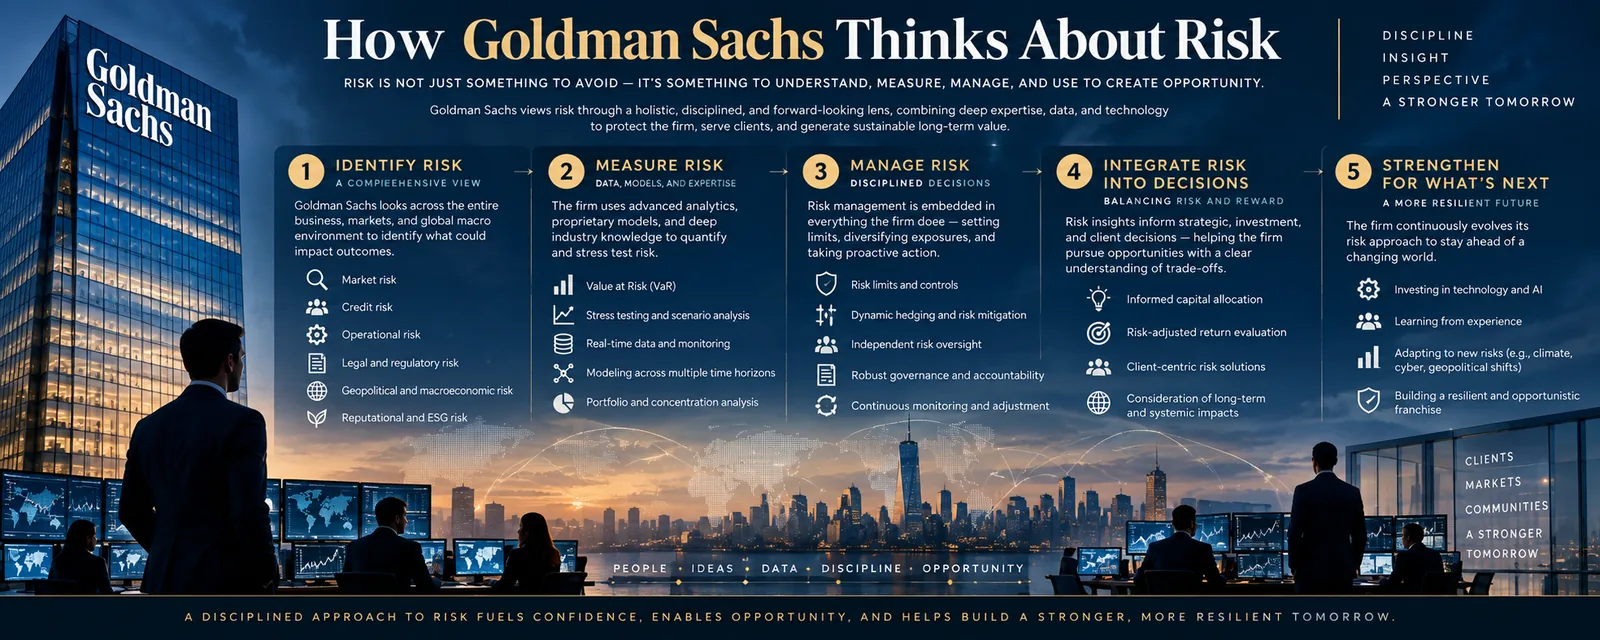 AnalysisEducationHow Goldman Sachs Thinks About RiskThe first question in institutional trading is how much can be lost, how quickly, and who will act. Goldman Sachs offers a useful lens on that discipline: risk is measured, challenged and escalated throughout the life of a position.@Abe5 min read
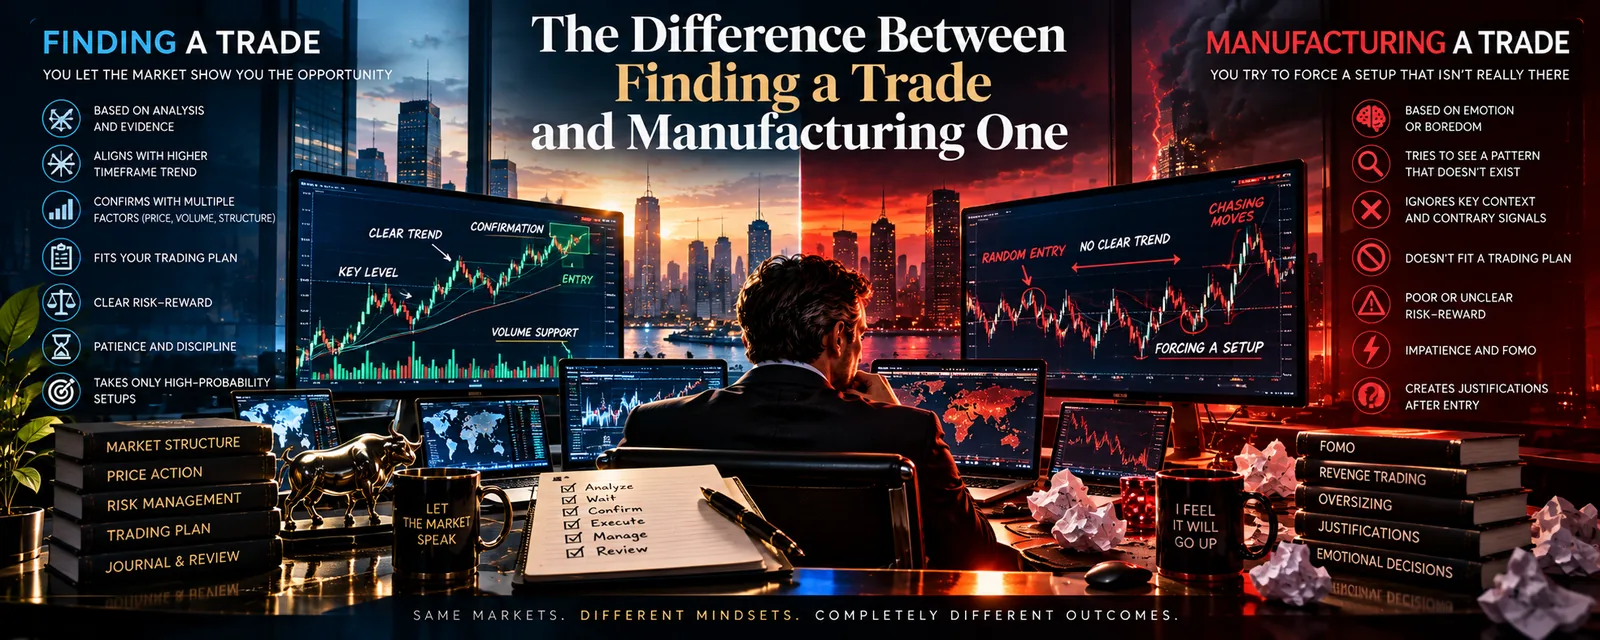 AnalysisEducationThe Difference Between Finding a Trade and Manufacturing OneA valid setup starts with predefined conditions. A forced trade starts with the desire to be in the market, then searches for evidence to justify it. Both can look convincing on the same chart.@Abe5 min read